_images/logo_light.svg_images/logo_dark.svg

PyPI Status Python Version License Read the documentation at https://nbpreview.readthedocs.io/ Tests Codecov pre-commit Black Imports: isort security: bandit

A terminal viewer for Jupyter notebooks. It’s like cat for ipynb files.

% nbpreview --theme material --image-drawing braille notebook.ipynb
       nbpreview                                                               
      ─────────────────────────────────────────────────────────────────────────

     ╭────────────────────────────────────────────────────────────────────────╮
[1]:from typing import Optional                                            │
     │                                                                        │
     │ import arviz as az                                                     │
     │ import matplotlib.pyplot as plt                                        │
     │ import pandas as pd                                                    │
     │ import pymc as pm                                                      │
     │ from arviz import InferenceData                                        │
     │ from matplotlib.axes import Axes                                       │
     │ from matplotlib.axes._subplots import Subplot                          │
     │ from pandas import DataFrame                                           │
     │                                                                        │
     │ import plots                                                           │
     ╰────────────────────────────────────────────────────────────────────────╯

      Thanks for checking out nbpreview. This example notebook is inspired by
      an example in Bayesian Analysis with Python by Osvaldo Martin. A more
      detailed breakdown of how nbpreview renders notebooks, examples, and
      command-line options may be found in the documentation.


      ## Load data                                                             
      ─────────────────────────────────────────────────────────────────────────

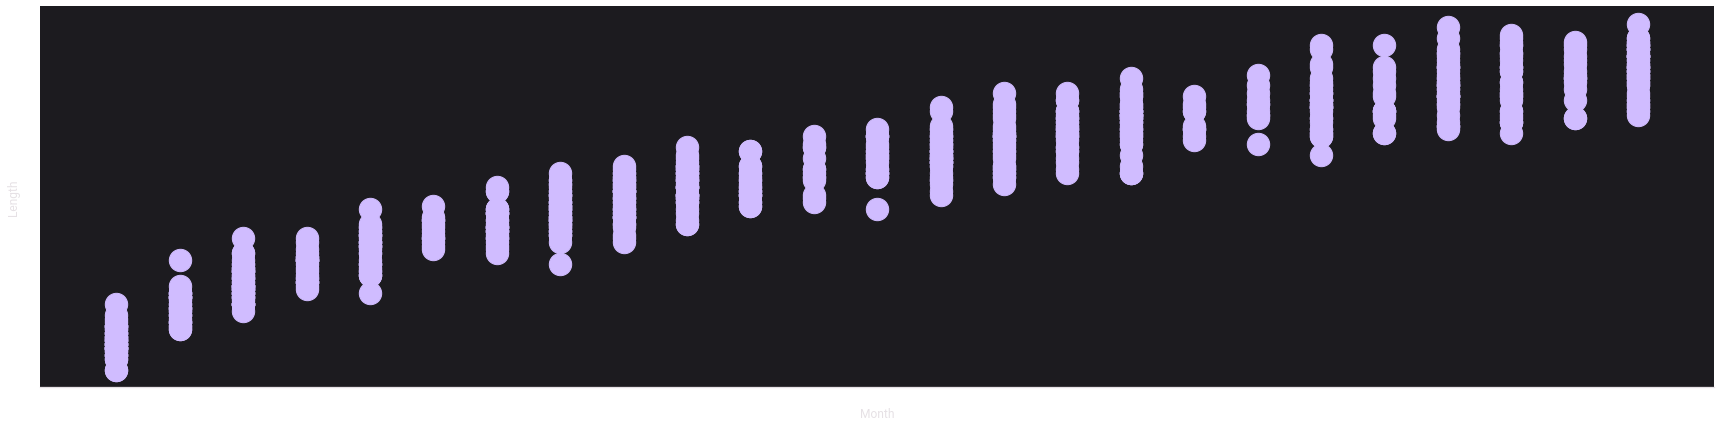
      This dataset contains the heights (Length) and age (Month) of newborn
      girls.

     ╭────────────────────────────────────────────────────────────────────────╮
[2]:babies_data = pd.read_csv(                                             │
     │     "https://github.com/aloctavodia/BAP/blob/master/code/data/babies.… │
     │ ).rename(columns={"Lenght": "Length"})                                 │
     │ months_of_interest = list(range(0, 13, 4))                             │
     │ (                                                                      │
     │     babies_data.groupby("Month")                                       │
     │     .agg(                                                              │
     │         mean_length=("Length", "mean"),                                │
     │         median_length=("Length", "median"),                            │
     │         mean_std=("Length", "std"),                                    │
     │         measurement_count=("Month", "count"),                          │
     │     )                                                                  │
     │     .loc[months_of_interest]                                           │
     │ )                                                                      │
     ╰────────────────────────────────────────────────────────────────────────╯

[2]:  🌐 Click to view HTML

[2]:           mean_length   median_length   mean_std   measurement_count
       Month                                                             
      ────────────────────────────────────────────────────────────────────
           0     49.458333           49.25   1.824285                  48
           4     62.060606           62.50   2.548767                  33
           8     68.809524           69.00   2.677714                  42
          12     74.456522           74.50   2.549122                  23

     ╭────────────────────────────────────────────────────────────────────────╮
[3]:babies_data.plot.scatter(                                              │
     │     x="Month",                                                         │
     │     y="Length",                                                        │
     │     figsize=(30, 7),                                                   │
     │     s=500,                                                             │
     │     xticks=[],                                                         │
     │     yticks=[],                                                         │
     │ );                                                                     │
     ╰────────────────────────────────────────────────────────────────────────╯

      🖼 Click to view Image

      ⣿⡏⠉⠉⠉⠉⠉⠉⠉⠉⠉⠉⠉⠉⠉⠉⠉⠉⠉⠉⠉⠉⠉⠉⠉⠉⠉⠉⠉⠉⠉⠉⠉⠉⠉⠉⠉⠉⠉⠉⠉⠉⠉⠉⠉⠉⠉⠉⠉⠉⠉⠉⠉⠉⠉⢉⡉⠉⣉⠉⠉⠉⢩⡍⠉⢉⡉⠉⠉⠉⢹
      ⣿⡇⠀⠀⠀⠀⠀⠀⠀⠀⠀⠀⠀⠀⠀⠀⠀⠀⠀⠀⠀⠀⠀⠀⠀⠀⠀⠀⠀⠀⠀⠀⠀⠀⠀⠀⠀⠀⠀⠀⠀⠀⣀⠀⠀⡀⠀⢠⡄⠀⢀⠀⠀⠀⢸⠀⠀⠀⢸⡇⠀⠀⠀⢸
      ⣿⡇⠀⠀⠀⠀⠀⠀⠀⠀⠀⠀⠀⠀⠀⠀⠀⠀⠀⠀⠀⠀⠀⠀⠀⠀⠀⠀⠀⡀⠀⠀⠀⠀⣀⠀⢀⣄⠀⡇⠀⠀⠀⢸⡇⠀⠀⠀⢸⠂⠀⠀⢸⠇⠀⠀⠀⢸
      ⣿⡇⠀⠀⠀⠀⠀⠀⠀⠀⠀⠀⠀⠀⠀⠀⠀⠀⠀⠀⢀⡀⠀⡄⠀⠀⢸⡇⠀⠀⠸⡇⠀⠀⠀⢸⡇⠀⠈⠀⠀⠉⠀⠘⠃⠀⠀⠀⠀⠀⠀⠀⠀⠀⠀⠀⠀⠀⠀⠀⢸
      ⣿⡇⠀⠀⠀⠀⠀⠀⠀⠀⡀⠀⢀⡀⠀⠀⠀⠀⢸⡇⠀⠀⠸⠃⠀⠀⠐⠀⠈⠁⠀⠈⠀⠀⠀⠀⠀⠀⠀⠀⠀⠀⠀⠀⠀⠀⠀⠀⠀⠀⠀⠀⠀⠀⠀⠀⠀⠀⠀⠀⠀⢸
      ⣿⡇⠀⠀⠀⠀⠀⠀⠀⠀⢸⠀⠀⠀⠘⠅⠀⠉⠀⠀⠀⠀⠀⠀⠀⠀⠀⠀⠀⠀⠀⠀⠀⠀⠀⠀⠀⠀⠀⠀⠀⠀⠀⠀⠀⠀⠀⠀⠀⠀⠀⠀⠀⠀⠀⠀⠀⠀⠀⠀⠀⠀⠀⢸
      ⣿⡇⠀⠀⡆⠀⠀⠀⠀⠈⠁⠀⠙⠀⠀⠀⠀⠀⠀⠀⠀⠀⠀⠀⠀⠀⠀⠀⠀⠀⠀⠀⠀⠀⠀⠀⠀⠀⠀⠀⠀⠀⠀⠀⠀⠀⠀⠀⠀⠀⠀⠀⠀⠀⠀⠀⠀⠀⠀⠀⠀⠀⠀⠀⠀⠀⠀⠀⠀⢸
      ⣿⡇⠀⠀⡇⠀⠈⠀⠀⠀⠀⠀⠀⠀⠀⠀⠀⠀⠀⠀⠀⠀⠀⠀⠀⠀⠀⠀⠀⠀⠀⠀⠀⠀⠀⠀⠀⠀⠀⠀⠀⠀⠀⠀⠀⠀⠀⠀⠀⠀⠀⠀⠀⠀⠀⠀⠀⠀⠀⠀⠀⠀⠀⠀⠀⠀⠀⠀⠀⠀⠀⢸
      ⣿⣷⣶⣶⣶⣶⣶⣶⣶⣶⣶⣶⣶⣶⣶⣶⣶⣶⣶⣶⣶⣶⣶⣶⣶⣶⣶⣶⣶⣶⣶⣶⣶⣶⣶⣶⣶⣶⣶⣶⣶⣶⣶⣶⣶⣶⣶⣶⣶⣶⣶⣶⣶⣶⣶⣶⣶⣶⣶⣶⣶⣶⣶⣶⣶⣶⣶⣶⣶⣶⣶⣶⣾


      ## Make model                                                            
      ─────────────────────────────────────────────────────────────────────────

      We'll model Length as a linear function of the square root of Month.

       Length  ∼𝒩(μ= α+ β√(Month), ϵ)

      Where the variance itself is also a linear function of Month.

       ϵ∼γ+ σMonth


     ╭────────────────────────────────────────────────────────────────────────╮
[4]:with pm.Model(coords={"time_idx": babies_data.index}) as babies_model: │
     │     # Priors                                                           │
     │     alpha = pm.Normal("alpha", sigma=10)                               │
     │     beta = pm.Normal("beta", sigma=10)                                 │
     │     gamma = pm.HalfNormal("gamma", sigma=10)                           │
     │     sigma = pm.HalfNormal("sigma", sigma=10)                           │
     │                                                                        │
     │     month = pm.MutableData(                                            │
     │         "month",                                                       │
     │         value=babies_data["Month"].astype(float),                      │
     │     )                                                                  │
     │                                                                        │
     │     mu = pm.Deterministic(                                             │
     │         "mu",                                                          │
     │         alpha + beta * month ** 0.5,                                   │
     │         dims="time_idx",                                               │
     │     )                                                                  │
     │     epsilon = pm.Deterministic(                                        │
     │         "epsilon",                                                     │
     │         gamma + sigma * month,                                         │
     │         dims="time_idx",                                               │
     │     )                                                                  │
     │     pm.Normal(                                                         │
     │         "length",                                                      │
     │         mu=mu,                                                         │
     │         sigma=epsilon,                                                 │
     │         observed=babies_data["Length"],                                │
     │         dims="time_idx",                                               │
     │     )                                                                  │
     │                                                                        │
     │     # Sample model                                                     │
     │     babies_idata = pm.sample(tune=2_000, return_inferencedata=True)    │
     │     babies_idata.extend(pm.sample_posterior_predictive(babies_idata))  │
     ╰────────────────────────────────────────────────────────────────────────╯

                                                                               
       Auto-assigning NUTS sampler...                                          
       Initializing NUTS using jitter+adapt_diag...                            
       Multiprocess sampling (4 chains in 4 jobs)                              
       NUTS: [alpha, beta, gamma, sigma]                                       
                                                                               

      🌐 Click to view HTML

      100.00% [12000/12000 00:07<00:00 Sampling 4 chains, 0 divergences]

                                                                               
       Sampling 4 chains for 2_000 tune and 1_000 draw iterations (8_000 +     
       4_000 draws total) took 20 seconds.                                     
                                                                               

      🌐 Click to view HTML

      100.00% [4000/4000 00:00<00:00]

     ╭────────────────────────────────────────────────────────────────────────╮
[5]:epsilon                                                                │
     ╰────────────────────────────────────────────────────────────────────────╯

[5]:  epsilon∼Deterministic(f(gamma, sigma))


      ## Plots                                                                 
      ─────────────────────────────────────────────────────────────────────────

      Let's plot the fit as a band where we expect 95% of the data to be
      contained in.

     ╭────────────────────────────────────────────────────────────────────────╮
[6]:_, hdi_ax = plt.subplots(figsize=(25, 5))                              │
     │ az.plot_hdi(                                                           │
     │     x=babies_data["Month"],                                            │
     │     y=babies_idata["posterior_predictive"]["length"],                  │
     │     hdi_prob=0.95,                                                     │
     │     fill_kwargs={"alpha": 1.0},                                        │
     │     ax=hdi_ax,                                                         │
     │ ).set(xticks=[], yticks=[]);                                           │
     ╰────────────────────────────────────────────────────────────────────────╯

      🖼 Click to view Image

      ⡏⠉⠉⠉⠉⠉⠉⠉⠉⠉⠉⠉⠉⠉⠉⠉⠉⠉⠉⠉⠉⠉⠉⠉⠉⠉⠉⠉⠉⠉⠉⠉⠉⠉⠉⠉⠉⠉⠉⠉⠉⠉⠉⠉⠉⠉⠉⠉⠉⠉⠉⠉⠉⠉⠉⠉⠉⠉⠉⢉⣉⣉⣉⣉⣉⣩⣭⣭⡍⠉⠉⢹
      ⡇⠀⠀⠀⠀⠀⠀⠀⠀⠀⠀⠀⠀⠀⠀⠀⠀⠀⠀⠀⠀⠀⠀⠀⠀⠀⠀⠀⠀⠀⠀⠀⠀⠀⠀⠀⠀⠀⠀⠀⢀⣀⣀⣀⣀⣤⣤⣤⣴⣶⣶⣶⣶⣶⣿⣿⣿⣿⣿⣿⣿⣿⣿⣿⣿⣿⣿⣿⡇⠀⠀⢸
      ⡇⠀⠀⠀⠀⠀⠀⠀⠀⠀⠀⠀⠀⠀⠀⠀⠀⠀⠀⠀⠀⠀⠀⠀⠀⣀⣀⣠⣤⣤⣤⣶⣶⣶⣶⣿⣿⣿⣿⣿⣿⣿⣿⣿⣿⣿⣿⣿⣿⣿⣿⣿⠿⠿⠿⠿⠟⠛⠛⠛⠛⠛⠛⠛⠉⠉⠉⠁⠀⠀⢸
      ⡇⠀⠀⠀⠀⠀⠀⠀⠀⠀⠀⠀⠀⢀⣀⣤⣤⣴⣶⣶⣾⣿⣿⣿⣿⣿⣿⣿⣿⣿⣿⡿⠿⠿⠿⠛⠛⠛⠛⠛⠉⠉⠉⠉⠉⠀⠀⠀⠀⠀⠀⠀⠀⠀⠀⠀⠀⠀⠀⠀⠀⠀⠀⠀⠀⠀⠀⠀⠀⠀⢸
      ⡇⠀⠀⠀⠀⠀⠀⣠⣤⣶⣾⣿⣿⣿⣿⣿⣿⠿⠿⠛⠛⠛⠋⠉⠉⠉⠀⠀⠀⠀⠀⠀⠀⠀⠀⠀⠀⠀⠀⠀⠀⠀⠀⠀⠀⠀⠀⠀⠀⠀⠀⠀⠀⠀⠀⠀⠀⠀⠀⠀⠀⠀⠀⠀⠀⠀⠀⠀⠀⠀⢸
      ⡇⠀⠀⢀⣤⣶⣿⣿⣿⠿⠟⠛⠋⠉⠉⠀⠀⠀⠀⠀⠀⠀⠀⠀⠀⠀⠀⠀⠀⠀⠀⠀⠀⠀⠀⠀⠀⠀⠀⠀⠀⠀⠀⠀⠀⠀⠀⠀⠀⠀⠀⠀⠀⠀⠀⠀⠀⠀⠀⠀⠀⠀⠀⠀⠀⠀⠀⠀⠀⠀⠀⠀⢸
      ⡇⠀⠀⢸⠿⠛⠋⠁⠀⠀⠀⠀⠀⠀⠀⠀⠀⠀⠀⠀⠀⠀⠀⠀⠀⠀⠀⠀⠀⠀⠀⠀⠀⠀⠀⠀⠀⠀⠀⠀⠀⠀⠀⠀⠀⠀⠀⠀⠀⠀⠀⠀⠀⠀⠀⠀⠀⠀⠀⠀⠀⠀⠀⠀⠀⠀⠀⠀⠀⠀⠀⠀⢸

      Let's directly compare the distributions of lengths for newborns that are
      0, 4, 8, and 12 months old.

     ╭────────────────────────────────────────────────────────────────────────╮
[7]:_, dist_ax = plt.subplots(figsize=(25, 5))                             │
     │                                                                        │
     │                                                                        │
     │ def plot_length_dist(                                                  │
     │     babies_idata: InferenceData,                                       │
     │     babies_data: DataFrame,                                            │
     │     month: int,                                                        │
     │     ax: Optional[Axes] = None,                                         │
     │     color: Optional[str] = None,                                       │
     │ ) -> Subplot:                                                          │
     │     """Plot the length distribution given an age in months."""         │
     │     if ax is None:                                                     │
     │         ax = plt.gca()                                                 │
     │                                                                        │
     │     length_data = babies_idata.sel(                                    │
     │         time_idx=babies_data.loc[lambda df: df["Month"] == month].ind… │
     │     )["posterior_predictive"].stack(                                   │
     │         dim=[                                                          │
     │             "chain",                                                   │
     │             "draw",                                                    │
     │             "time_idx",                                                │
     │         ]                                                              │
     │     )[                                                                 │
     │         "length"                                                       │
     │     ]                                                                  │
     │     plot = az.plot_dist(                                               │
     │         length_data,                                                   │
     │         fill_kwargs={"alpha": 1},                                      │
     │         ax=ax,                                                         │
     │         color=color,                                                   │
     │     )                                                                  │
     │     return plot                                                        │
     │                                                                        │
     │                                                                        │
     │ for idx, month in enumerate(months_of_interest):                       │
     │     color = f"C{idx}"                                                  │
     │     plot_length_dist(                                                  │
     │         babies_idata,                                                  │
     │         babies_data=babies_data,                                       │
     │         month=month,                                                   │
     │         color=color,                                                   │
     │         ax=dist_ax,                                                    │
     │     ).set(xticks=[], yticks=[]);                                       │
     ╰────────────────────────────────────────────────────────────────────────╯

      🖼 Click to view Image

      ⡏⠉⠉⠉⠉⠉⠉⠉⠉⠉⠉⠉⠉⠉⠉⠉⣩⡉⠉⠉⠉⠉⠉⠉⠉⠉⠉⠉⠉⠉⠉⠉⠉⠉⠉⠉⢉⣉⠉⠉⠉⠉⠉⠉⠉⠉⠉⠉⠉⠉⠉⠉⠉⠉⠉⠉⠉⠉⠉⠉⠉⠉⠉⠉⠉⠉⠉⠉⠉⠉⠉⢹
      ⡇⠀⠀⠀⠀⠀⠀⠀⠀⠀⠀⠀⠀⠀⠀⣿⣿⣿⡆⠀⠀⠀⠀⠀⠀⠀⠀⠀⠀⠀⠀⠀⠀⠀⠀⣰⣿⣿⣷⡀⠀⠀⠀⠀⣰⣾⣶⡄⠀⠀⠀⣠⣤⣀⠀⠀⠀⠀⠀⠀⠀⠀⠀⠀⠀⠀⠀⠀⠀⠀⠀⢸
      ⡇⠀⠀⠀⠀⠀⠀⠀⠀⠀⠀⠀⠀⠀⢰⣿⣿⣿⣿⣿⡄⠀⠀⠀⠀⠀⠀⠀⠀⠀⠀⠀⠀⠀⠀⣰⣿⣿⣿⣿⣷⡀⠀⠀⣼⣿⣿⣿⣿⣄⣾⣿⣿⣿⣷⡀⠀⠀⠀⠀⠀⠀⠀⠀⠀⠀⠀⠀⠀⠀⠀⢸
      ⡇⠀⠀⠀⠀⠀⠀⠀⠀⠀⠀⠀⠀⢠⣿⣿⣿⣿⣿⣿⣷⠀⠀⠀⠀⠀⠀⠀⠀⠀⠀⠀⠀⠀⣰⣿⣿⣿⣿⣿⣿⣧⣼⣿⣿⣿⣿⣿⣾⣿⣿⣿⣿⣿⣷⡀⠀⠀⠀⠀⠀⠀⠀⠀⠀⠀⠀⠀⠀⠀⢸
      ⡇⠀⠀⠀⠀⠀⠀⠀⠀⠀⠀⠀⢀⣾⣿⣿⣿⣿⣿⣿⣿⣧⠀⠀⠀⠀⠀⠀⠀⠀⠀⠀⠀⣿⣿⣿⣿⣿⣿⣿⣿⣿⣿⣿⣿⣿⣿⣿⣿⣿⣿⣿⣿⣿⣿⣿⣿⣄⠀⠀⠀⠀⠀⠀⠀⠀⠀⠀⠀⠀⠀⢸
      ⡇⠀⠀⠀⠀⠀⠀⠀⠀⠀⠀⣾⣿⣿⣿⣿⣿⣿⣿⣿⣿⣧⡀⠀⠀⠀⠀⠀⠀⠀⠀⣰⣿⣿⣿⣿⣿⣿⣿⣿⣿⣿⣿⣿⣿⣿⣿⣿⣿⣿⣿⣿⣿⣿⣿⣿⣦⡀⠀⠀⠀⠀⠀⠀⠀⠀⠀⠀⠀⢸
      ⡇⠀⠀⠀⠀⠀⢀⣀⣠⣴⣿⣿⣿⣿⣿⣿⣿⣿⣿⣿⣿⣿⣿⣀⣀⠀⣀⣀⣿⣿⣿⣿⣿⣿⣿⣿⣿⣿⣿⣿⣿⣿⣿⣿⣿⣿⣿⣿⣿⣿⣀⣀⠀⠀⠀⠀⠀⠀⢸